
Pitching Mechanics Rankings: Starting Pitchers in the 2022 MLB Playoffs
Earlier this year, I wrote a case study about the Decline of MLB Starting Pitching. The case study was built off looking at over a decade of the top three pitchers drafted each year by MLB Teams. Overall, the case study supported the notion of the decline of the “traditional” starting pitcher as the MLB moves forward.
As the 2022 MLB Playoffs approached this year, I felt it would be advantageous to analyze the pitching mechanics or the sequencing of a pitcher’s delivery (DVS Score) of the core starting pitchers from all MLB Teams that advanced to the playoffs. This small case study will help provide further insight into pitching mechanics, injuries, and trends seen among current MLB starting pitchers and the direction of the MLB moving forward. In this case study, seventy pitchers were assigned a DVS Score compared with relative performance, injury, salary, and mechanical data. If you want to jump to the DVS Score rankings, click the Full Rankings button below and download the pdf.
If you are unfamiliar with our proprietary analysis of the pitching delivery using the Delivery Value System which produces a DVS Score, you can click the tabs below to learn more as to why the DVS Score is an important tool in analyzing pitchers.
-
The Delivery Value System is the biomechanics model DVS Baseball uses to analyze baseball pitchers. The model objectively evaluates a pitcher's delivery sequence using manual and automated markerless motion capture. The Delivery Value System consists of six components of sequencing in the delivery, which are summed into an overall score; the DVS Score. The higher the pitcher's overall DVS Score (0 to 24), the more innings he can accumulate before a significant arm injury. To know the actual injury risk of any pitcher, the individual components that make up each DVS Score provide the actual probability of current and future risk. For example, two pitchers can have a 14 DVS Score, but one pitcher can be exponentially at greater risk of a significant arm injury because of the composition of his scoring components.
-
The Delivery Value System was built to look at current and future risk of a baseball pitcher without having to have a pitcher wear markers or visit a biomechanics lab to gather data on their pitching delivery. The foundation of our model focuses on the sequencing of movements and objectively quantifying those movements as it relates to throwing arm injuries all from 2D video. The goal was to use in-game footage of MLB pitchers across the history of baseball as the foundation of our biomechanics model. By using in-game footage of a MLB Pitcher, we are analyzing the sequencing of a pitcher in a functional game setting. If the footage is sufficient, we are able observe and provide DVS Scores on thousands of pitchers helping our ongoing Injury Risk Model continue to be applicable to predicting the probability of throwing arm injuries. Currently our model consists of over 2,000 former and current MLB Pitchers. In addition, the Delivery Value System has been through the rigors of validation and testing and was medically published in Orthopedics Medical Journal in January 2018.
-
This question was asked and answered as part of a formal study in 2016 and 2017 involving pitchers in the United Shore Professional Baseball League. The inital study focused on the effects of shoulder range of motion patterns and recovery as a product of a pitcher improving his DVS Score. Results indicated that as a pitcher improved his DVS Score, he also improved his recovery cycle, shoulder range-of-motion patterns, and increased his average fastball velocity. Overall, as the sequence of the pitching delivery improves (DVS Score), the utilization of more mass and leverage to pitch a baseball helps the arm tolerate stress better and transfer more mass & momentum into each pitch.
The methodology to improve a pitcher’s DVS Score is formally known as the Mechanics for Velocity and Performance (M.V.P.) Program.
2022 MLB Playoffs - Starting Pitcher Results
The DVS Scores provided in this analysis are not an indictment on any pitcher's current or future performance. The DVS Scores simply offer a portrait of where this group of starting pitchers rank with their peers and how their DVS Scores continue to show similar patterns in our database. The main takeaway of this analysis is this: MLB Teams have spent over 3 billion dollars on injured pitchers since 2015. That amounts to 187,000 days missed amongst 2600 pitchers. The rate of a major throwing arm injury suffered by the average professional pitcher continues to increase. As this analysis indicates, almost 50% of starting pitchers on the best MLB Teams find themselves in a high risk category.
Most MLB Teams utilize some bio-mechanical model to help aid in making player personnel decisions regarding contract value and length. Unfortunately, front offices seem more focused on maximizing the production of a pitcher in a set number of years than maximizing a pitcher's worth over an extended number of years. For example, a valued pitcher may be at high risk, but if most models indicate the next 2 to 3 years will yield high-performance years, they won't worry about trying to help him in the short term to secure long-term value. However, as my previous case study suggested, many high-round drafts picks suffer a major throwing injury early in their careers and provide little to no value to the MLB Team.
The chart below illustrates the distribution of DVS Scores for every pitcher in the case study. The average DVS Score for the entire case study is 12.8, below our historical average of 14.2. Why is this important?
DVS Scores for all 70 pitchers eligible to pitch in the 2022 MLB Playoffs
Correlations in MLB Teams
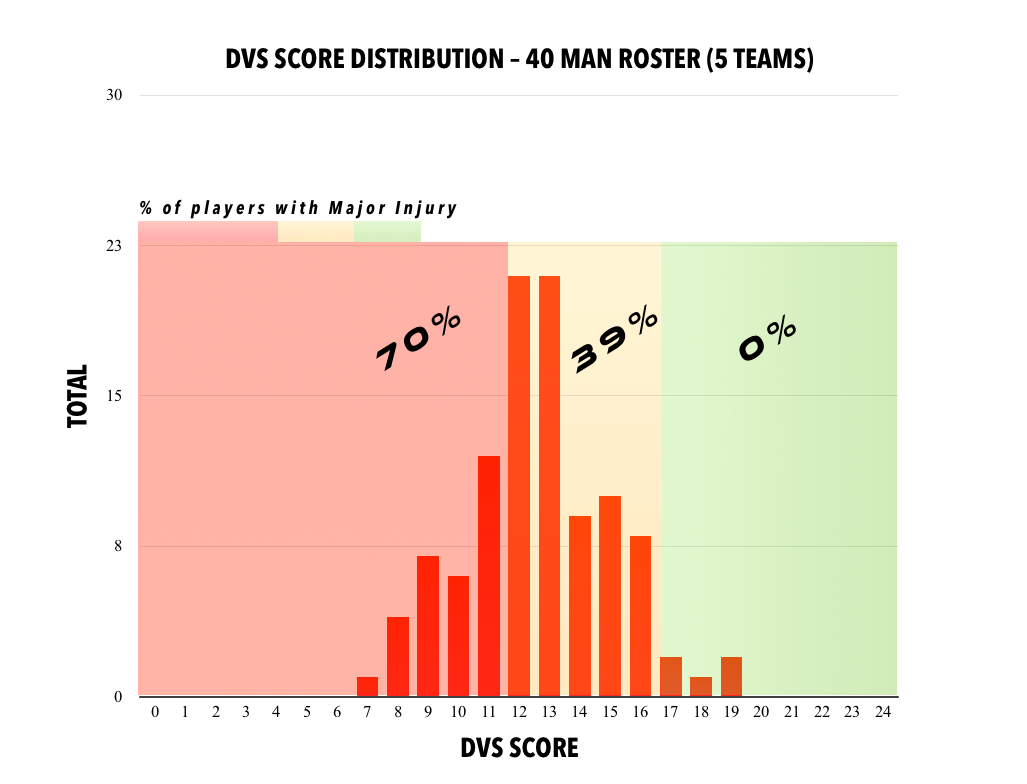
An easy way to quickly understand a simple correlation of how a pitcher's DVS Score can be used to show injury trends is to illustrate a case study we performed on five random MLB Teams. We used analyzed and produced a DVS Score on all pitchers on the 40-Man Roster of each of the five MLB Teams. The chart below showcases the varying levels of percentage of players who had undergone a major throwing injury (missing at least 90 days or more). All pitchers will likely get hurt at some point in their professional careers. But having a higher DVS Score prolongs the injury, thus allowing a pitcher to build a career and financial stability before the uncertainty involved with suffering a major arm injury.
Key Findings / Characteristics
Below are some key stats pulled out of this case study followed by some visual examples to help clarify some mechanical differences among pitchers.
In addition to 47% of the starting pitchers being in the high risk category, only 14% are in the low risk category.
Pitchers in the high risk category earned over $225 million during the 2022 season and missed over 1000 days to injury.
Only 12% of pitchers are on-time with their throwing arm at foot strike (see picture).
Pitchers with a DVS Score of 16 or higher have an average WAR of 3.75 vs. Pitchers with a DVS Score of 11 or below who have an average WAR of 1.45
Pitching deliveries have become more controlled and compact. Especially the manipulation of the throwing arm during the arm swing phase.
Shift in number of pitchers sitting down on the drive leg early in the pitching delivery in comparison to the drive leg moving down the slope of the mound (see picture).
Difference in Drive Leg during Acceleration Phase 1 of the pitching delivery
Pitchers that do not allow any forward movement of the drive leg after hand break increase the chance of a major throwing arm injury by 33%. The image below shows two different movement patterns to illustrate this point.

Top row: Julio Urias (top left) and Jose Berrios (top right) showing the shin moving forwards down the slow of the mound. Bottom row: Mike Clevinger (bottom left) and Noah Syndergaard (bottom right) showing little to now shin movement down the slope of the mound.
The movement pattern shown by both Clevinger and Syndergaard seems to be a new common training tactic to increase velocity in pitching. This movement may have positive correlations with increasing velocity. Still, this movement should note that it is also restrictive to the sequencing of the drive leg allowing the throwing arm to move on time naturally and into position.
Difference in Throwing Forearm at Foot-strike
As mentioned above, only 12% of all starting pitchers in the case study are on time with their throwing forearm at foot strike. On-time with the throwing forearm as it relates to the Delivery Value System is indicated by the forearm and spine being in parallel with one another. Notice the difference between Justin Verlander, who is on time, and Kevin Gausman, who is not.

Justin Verlander (left) vs. Kevin Gausman (right) at foot-strike
Conclusion
Justin Verlander, Clayton Kershaw, and Max Scherzer are great examples of how higher DVS Scores can impact a pitcher's health, success, and longevity. All three pitchers will likely be hall of fame pitchers and by no means does having a high DVS Score mean you will be a hall-of-fame pitcher. Still, any professional pitcher with the talent and intangibles but a low DVS Score may not have the same opportunity to achieve long-term success and financial gain as Verlander, Kershaw, and Scherzer because of their historically higher DVS Scores.
However, the majority of MLB Starting pitchers in this year's playoffs indicate the MLB will continue to inherit injury-plagued pitchers, and the cost of pitching injuries will remain high.