The 2022 Detroit Tigers: Developmental Flaws Led to a Lost Season
Frustrating.
That may be the one word that perfectly encapsulates the 2022 season for the Detroit Tigers. Coming into the season there was one expectation, and that was an improvement. Somehow the Tigers have managed to take what seems to be five steps backward. As of August 20th, the Tigers ranked 29th in OBP, 30th in Home Runs, 24th in Starter ERA and 29th in Starter K/9. It is important to note that once the season began, there were only so many controllable factors. At DVS we believe there were numerous steps that could’ve been taken to ultimately prevent the issue that set the Tigers back all season: Injuries.
In a year of high expectations, injuries have been the entire story. As Cody Stavenhagen discussed recently, one of the prominent problems this season has been pitching injuries across the entire pitching staff. Some of the most notable include the early exit of Casey Mize, Matt Manning, Jose Cisnero, and Kyle Funkhouser. All of these pitchers were expected to contribute in 2022. These four pitchers were only a piece of the puzzle that showcased a much larger problem. More notably, the five pitchers slated to be in the starting rotation spent a cumulative 356 days on the IL, and that’s only through August 20th.
On April 20th of this year, we released an article that addressed our concerns with the developmental system of the Detroit Tigers. We highlighted the problems that Detroit had dealt with in the past regarding pitching injuries. The article then took a more specific dive into breakdowns of potential injury risks, including Casey Mize (this was before he was slated for Tommy John Surgery). Since the day we posted that article, the pitching staff for Detroit has spent over 700 days combined on the injured list, and that’s not even counting the injuries before we released the article, which would equate to over 1000 total days.
To quantify this into player value, I first looked at the monetary loss. In 2022 the Tigers lost over 9 of the 43 million dollars they spent on the pitching staff to injury. Also it’s important to remember that half of that 43 million went to two players in Eduardo Rodriguez and Michael Pineda. The weight of salary loss is slightly skewed due to the staff being fairly new to the Major League level.
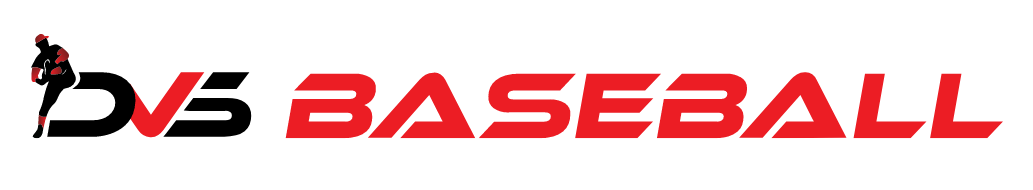
The financial impact was the immediate loss for the Tigers, but how do we figure out what the value was for the time lost to injury? I decided to take all of the physical pitching injuries and evaluate the estimated player WAR coming into 2022 (or 2023 if they were out the entire season). Using FanGraphs ZIPs projections, this equated to approximately just over 6.0 WAR. FanGraphs assigned a dollar value to 1.0 WAR as you can see below. So a loss of this magnitude equals almost 50 million dollars in lost value if we follow the 2020 price tag.
It’s obvious now that the major pitching losses to injury had more implications than just lost time. The question is, what can the Tigers do to get back on track as a team and organization?
Organizational Problems
There are many potential solutions for a problem as big as this one. Although, it may require a mix of things. The most immediate fix the Tigers seemed to take was the firing of General Manager Al Avila in August. Although we do not know what Al Avila specifically did to introduce the analytical era to the Tigers, we do know that the team had not been successful in development under him. Bill Felber of FanSided did a great analysis of Avila’s success (or lack thereof) with the Tigers. In an article highlighting the past successes and failures of Avila, Bill Felber said, “During his tenure, Avila’s farm system has produced 53 players who produced some level of value for the Tigers. As measured by Wins Above Average, only nine of those values were positive… By contrast, 40 of the Avila system’s products generated negative impacts on the Tigers, and 14 of those negative impacts exceeded -1.0 game.” The general understanding regarding this statement is that the development and drafting system must have some sort of flaw. The Tigers have picked high in the draft for a multitude of years, and have very little to show for it.
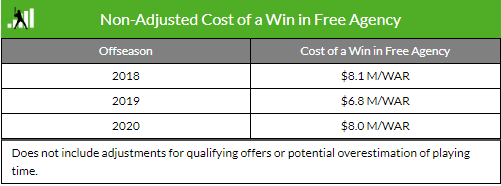
The lack of player development seems to be apparent at all levels, this includes Major League. Robbie Grossman was recently traded away to the Braves in the midst of one of the worst seasons of his career. Immediately with the Braves, he found success. This was reported by Cody Stavenhagen just recently. The replies to this tweet were filled with fans voicing complaints about how the Tigers seem behind the 8 ball in every facet of development.
While the firing of Avila seems to be a step in the right direction, the issue seems to be a flaw in more than just one person, but a systematic approach that ultimately is holding the team back. Let’s dive a little deeper and see if we can find the answer to this.
Pitching Plateau.
As technology has advanced, so has our understanding of pitching. New developmental and analytical systems provide a multitude of benefits for players of all ages. With these technologies come many businesses, camps, and developmental centers all promising the best results. Velocity numbers seem to be the number one marketing factor in the game today. Development centers promise increased MPH if a client joins for a certain amount of weeks. Scouts trend towards High Schoolers with high velocity. This is a direct result of how it has changed from the top down. As you can see from the FanGraphs chart, the trend over the past decade is certainly a positive trendline:

While the trendline is positive over the last decade, we are beginning to see somewhat of a plateau. Pitchers are pushing themselves to their highest intensities in order to create maximum velocity outcomes. According to this chart, relief pitchers in Major League Baseball have hit a velocity plateau. That being said, we did see the largest jump in SP velocity from a year-to-year standpoint in the history of FanGraphs. However, this follows a large correlation with the average outing length (I/GS) of the starting pitcher. Take a look at this quote from Kerry Miller, written earlier in the 2022 season regarding the average outing length of starters:
“As of Tuesday morning, there had been 244 games played in the 2022 season... Per FanGraphs, those 488 starts yielded 2,302.67 innings pitched, or 4.72 per start...
Going backward in three-year increments, the March/April average was 5.30 innings pitched per start in 2019, 5.68 in 2016 and 5.81 in 2013. And just one decade ago in 2012, it was almost exactly 6.0 innings pitched per start (5.999).”
Our biggest takeaway regarding the information above is that while velocity trends continue upward, innings pitched continue downward. Pitchers who work out of the bullpen (or in shorter stints) are then able to compensate for these velocity gains. However, the turnover in value for the team is lacking. As we mentioned in our previous article, our case study showed us that there are three major factors contributing to reduced innings for pitchers:
Arm Injuries
Inherited Risk
Transactions
You can read more in detail about those three factors in our article titled “Case Study: The Decline of MLB Starting Pitchers.” Although I’d like to speak about the second factor, inherited risk. We are now a results-driven baseball culture. These results are promoted through the private sector of baseball. Available now are so many arm-speed, velocity, and strength camps that are promoted all year round, even in important resting periods. Velocity has become a product that is sold, rather than a result of success in strength, speed, and sequencing. Risk is a byproduct of these camps, as it encourages throwing late into the year. Whether it be October, November, December, or January, an athlete is only further increasing his risk for potential injury. Available velocity camps and clinics don’t factor in the potential participation in High School baseball, Summer Ball, and Fall Ball. In a narrative review of Overuse & Injuries in youth athletes published in the Journal of Athletic Training, Jason L. Zaremski found that “Pitchers 9 to 14 years old who pitched more than 8 months per year were at 5 times greater risk of having surgery compared with those pitching fewer than 8 months per year.” As appalling as this stat is, it teaches us that the most important aspect of youth to high school training is education. Pitchers must simply know when to set the ball down. For those youth to high school pitchers who follow velocity programs late into the Fall, the risk is apparent.
“The growth of specialization to achieve optimal performance in the off-season combined with year-round playing options is the root of the pandemic of pitching injuries in baseball. The most potent billboard message from the private sector towards pitchers is “you must throw hard, and do whatever it takes, to create an opportunity to play at the next level. ”
The velocity-minded culture has now brought injury issues to the forefront of baseball. The direct result is an accelerated timetable to a potential arm injury. I encourage you to read this article by Mike Reinold regarding Weighted Baseballs, which are a staple of velocity development. To sum up the article, those using weighted baseballs were almost 24% more likely to face injury. This result occurs with increased layback in the arm, a byproduct of weighted ball use. The simple point is that while high velocity is a great asset for success, it must be achieved through a correct and safe process. These processes seem to have taken a backseat in the current developmental environment.

“Layback” being created with the throwing arm.
The reason I brought up current velocity trends is to help create a clearer understanding that the issue occurs in sequencing and mechanical decisions a pitcher makes. At DVS, we focus on sequencing first. Through our Injury Risk model, we evaluate and score players based on their sequencing, mainly focusing on timing issues in the delivery. Following this, we guide them through necessary corrections, and allow them to fix the problems. What we have found is that a majority of pitchers do not sequence well and are likely to experience injury if left unadjusted. Our database dates back 60 years and proves through thousands of established pitchers that if you sequence better, you can ultimately have a longer career. Our scoring system scores up to 24, with the MLB average being 13.4. We find that a score of 16 is usually the “minimum” indicator that a pitcher can sustain a solid workload throughout the season. Higher scores led to increased control over pitching factors such as velocity, sequencing, and control.
The DVS score is a direct representation of Malik’s efficiency in sequencing. His improvement had positive effects on both his health and performance.
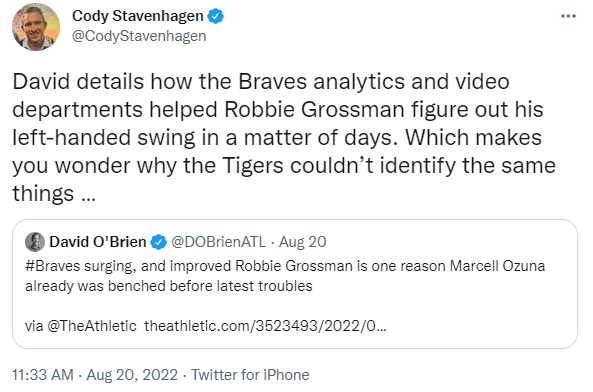
In the case of Major League Baseball, our scoring system allows us to determine the risk a pitcher inherits based on his sequencing. This visual chart allows you to see our direct correlation between major mechanical injury and DVS score:

So how does this relate to the Detroit Tigers?
I’m glad you asked.
Injury Risk, Injury Woes.
On April 20th of this year, the founder of this company released an article regarding his concern with the trajectory of the Detroit Tigers pitching staff. Through our IR model, Justin Orenduff pointed out a multitude of mechanical risks that would be listed as gateways to potential injury. Following the release of this article, the predictions turned out to be true.
Since the release of that article, these pitchers spent time on the Injured List in 2022:
Tyler Alexander
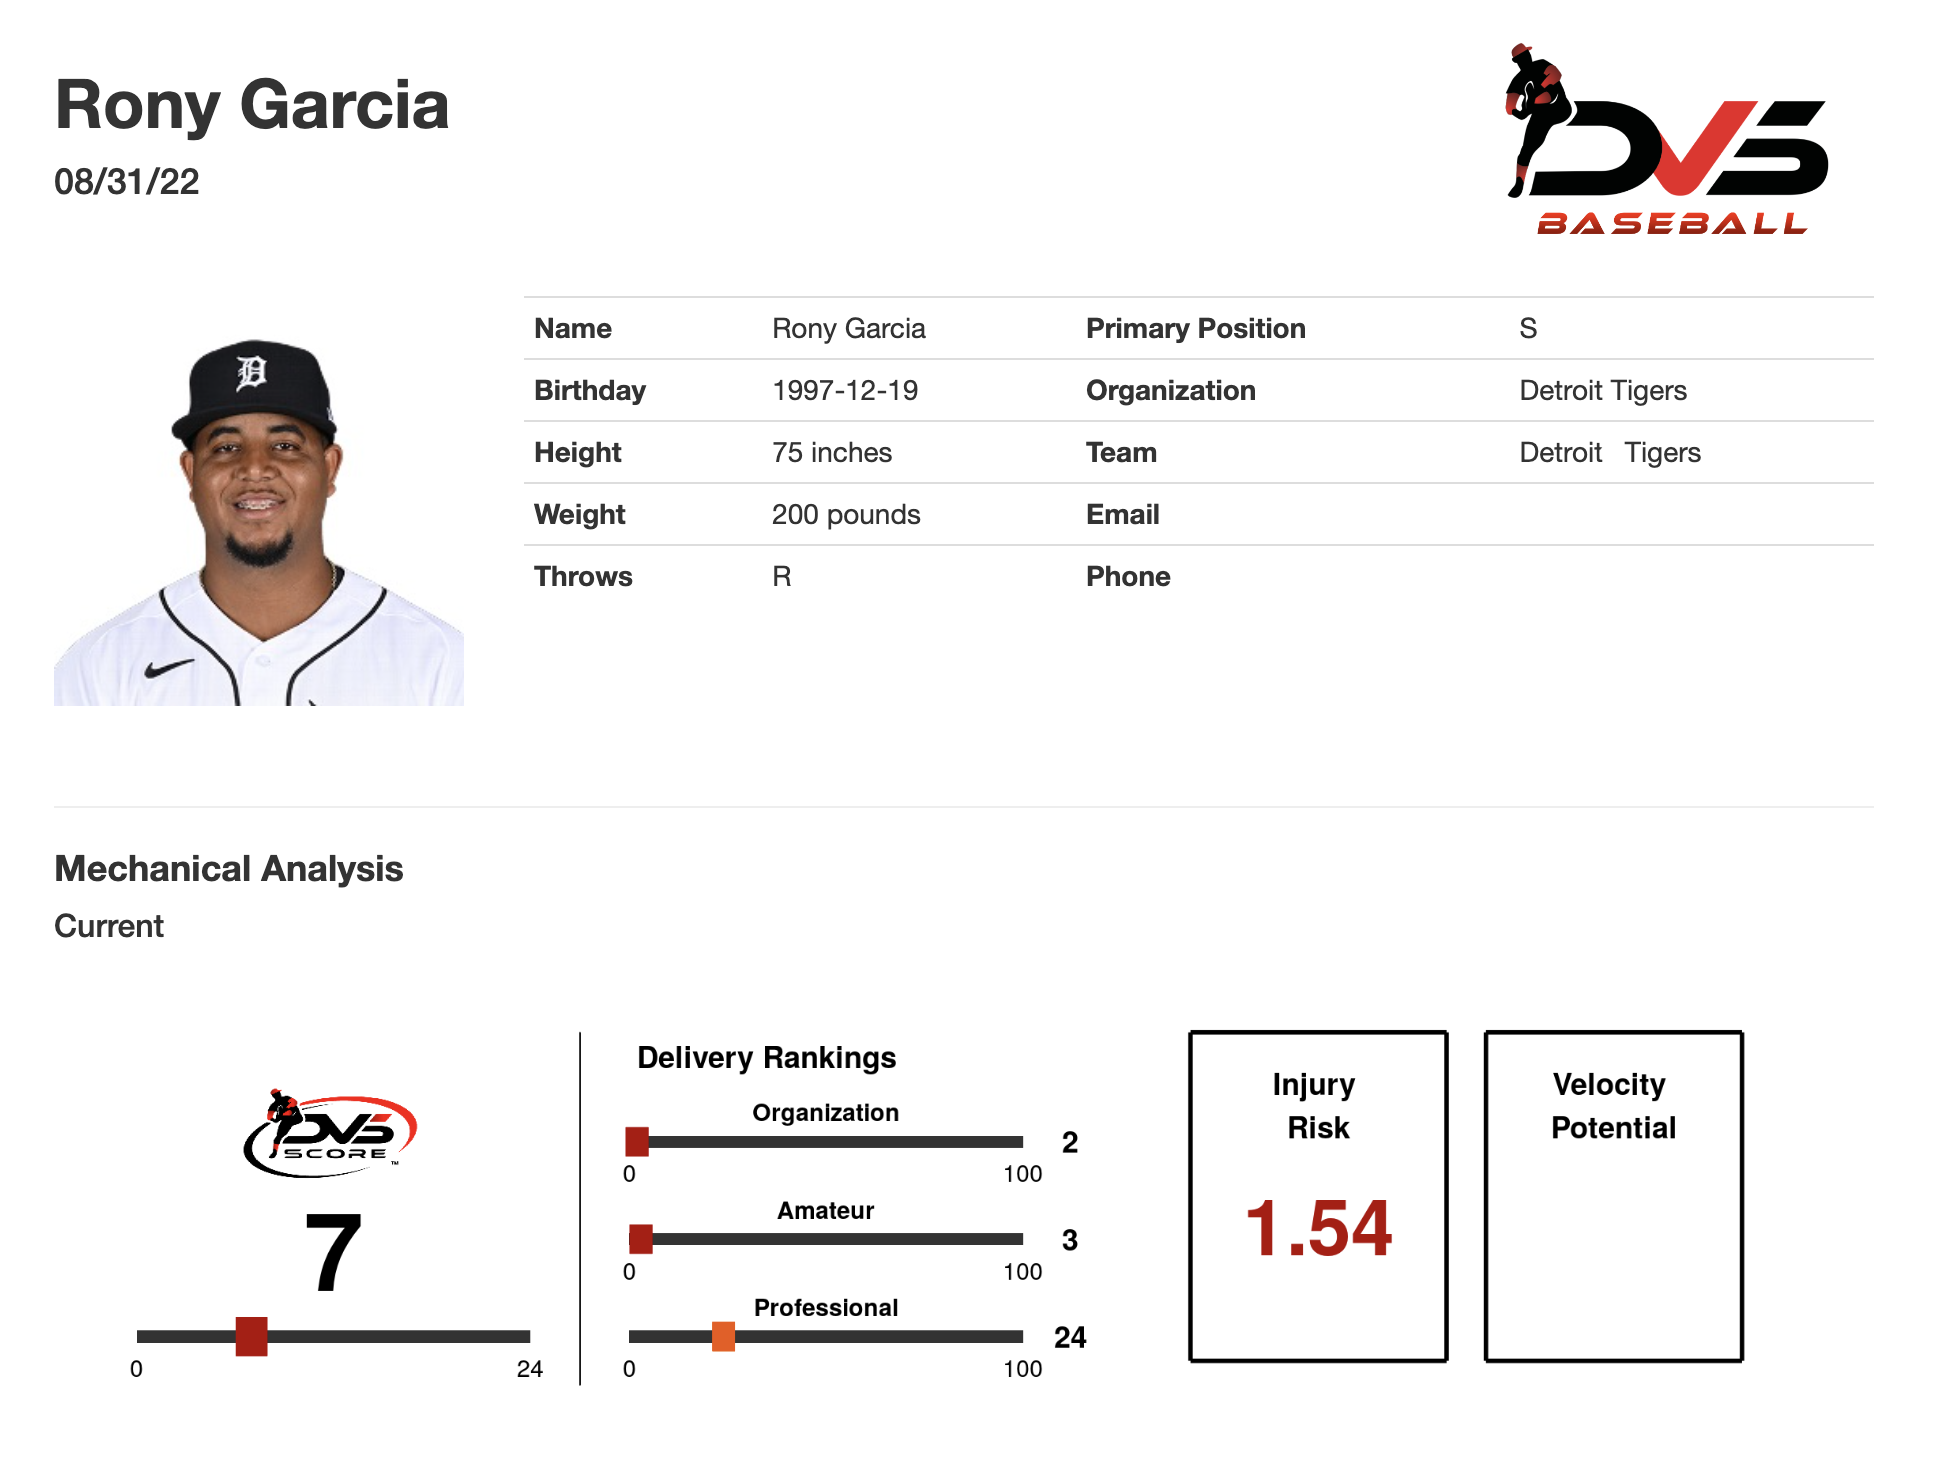
Rony Garcia
Wily Peralta
Eduardo Rodriguez
Micheal Pineda
Casey Mize
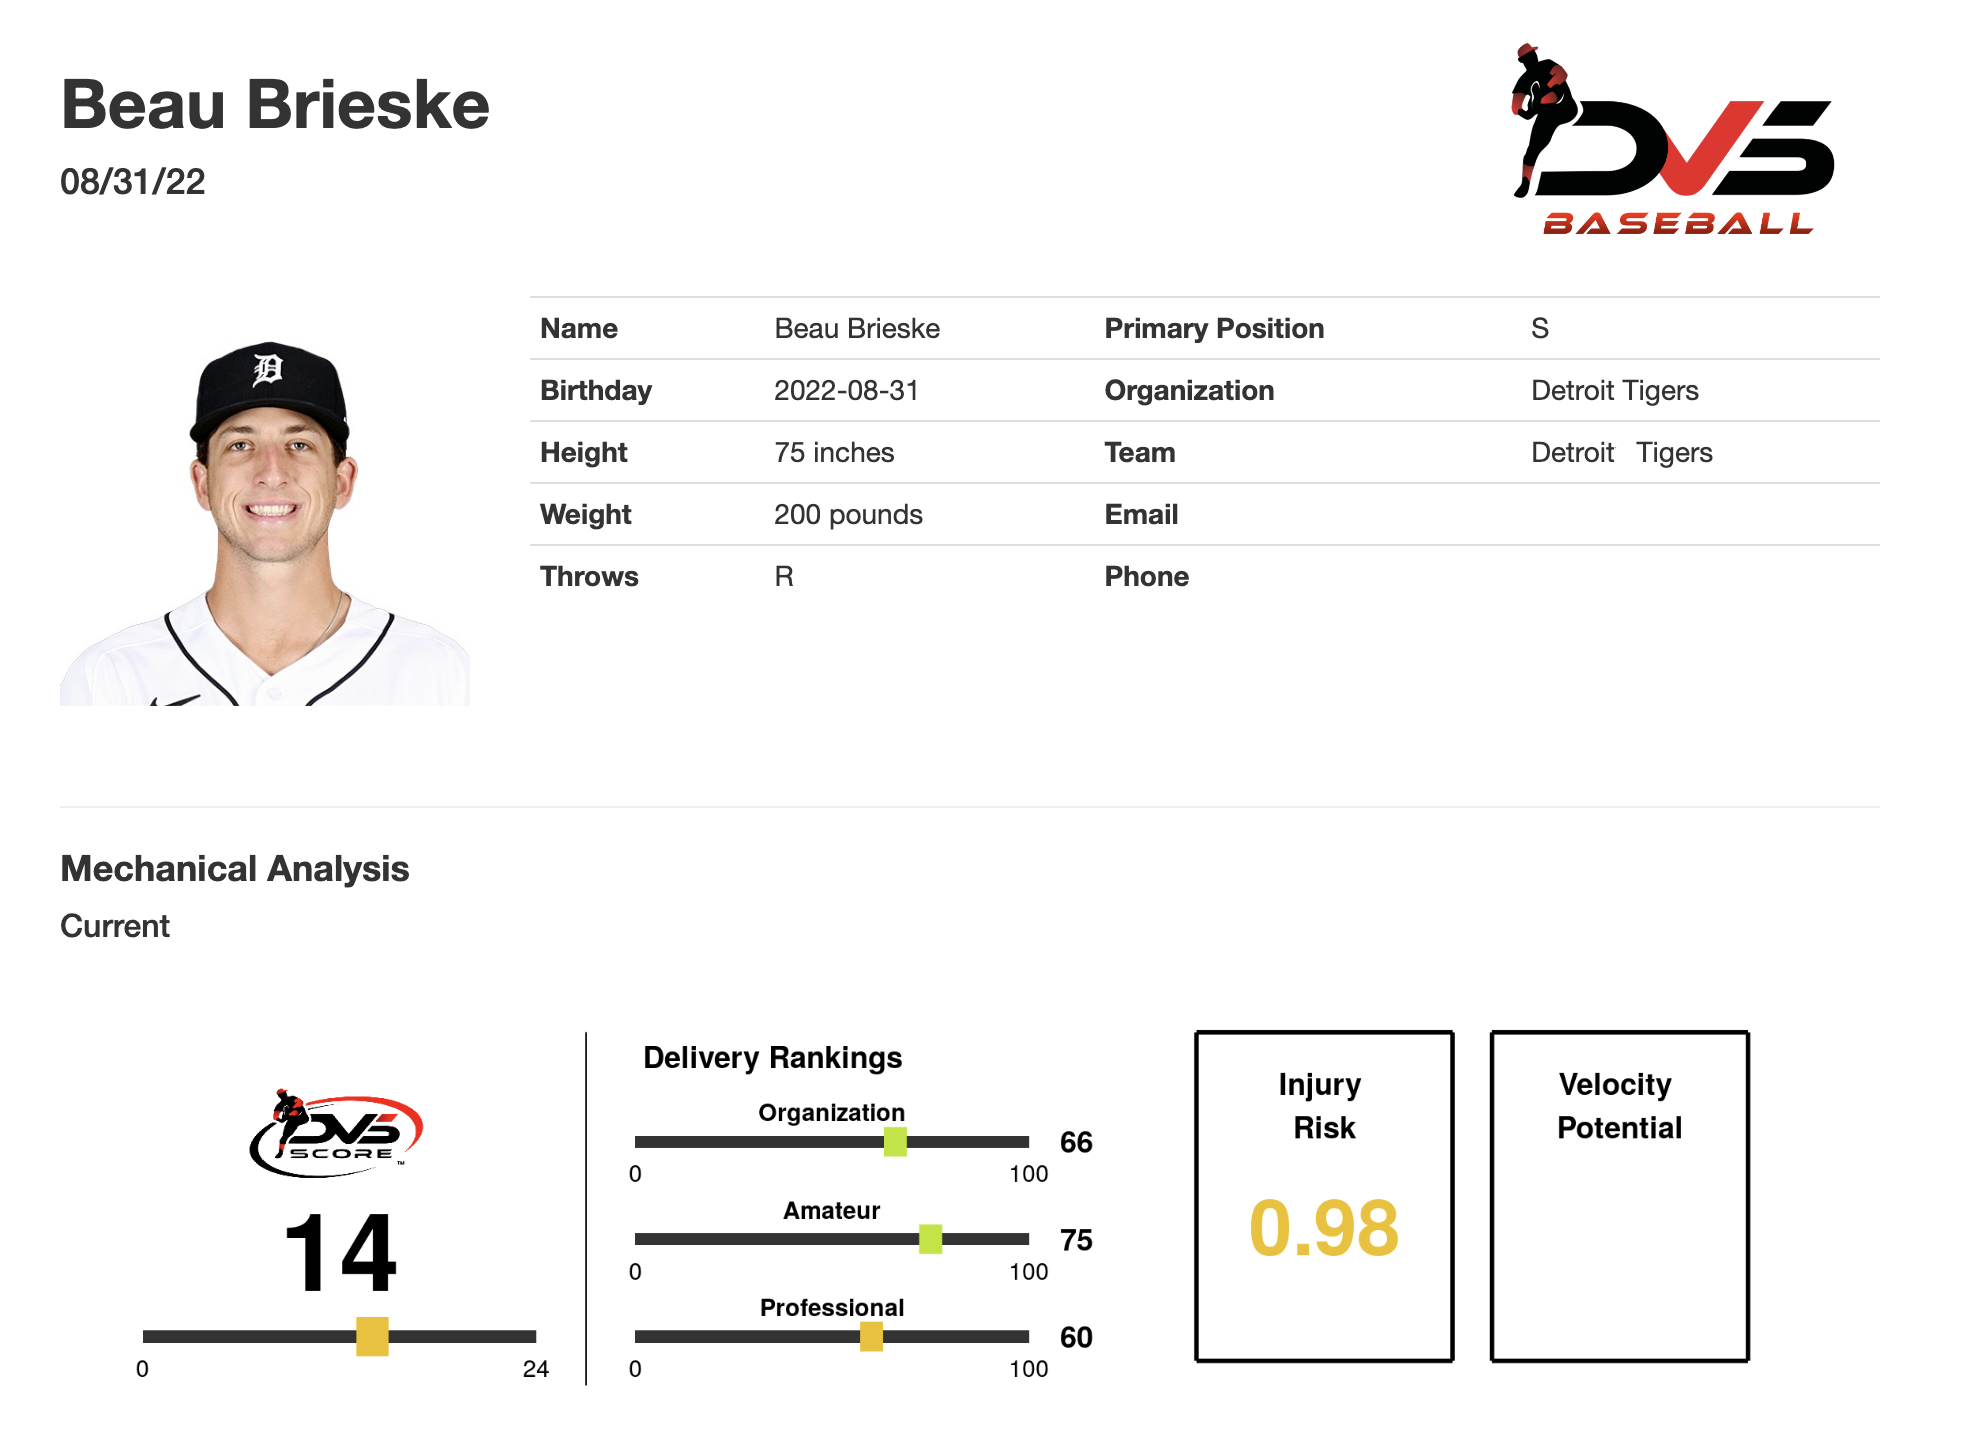
Beau Brieske
Tarik Skubal
Keep in mind, the list does not include the rollover injuries from last season or injuries that happened in the month of the regular season before our article was released. That list looks like this:
Andrew Chafin
Jose Cisnero
Matt Manning
Spencer Turnbull
By equating the total days missed, the pitching staff of the Detroit Tigers spent 1023 total days on the IL in 2022, with 733 of those days occurring after our article release (from new injuries).
To bring our DVS Scoring/IR model into the mix, the highest scoring Tiger was Tarik Skubal with a score of 15. Skubal recently joined the 60-day IL as he received flexor tendon surgery and was shut down for the year. 15 equates to an “at-risk” category, and the most successful pitchers tend to be in the 17-and-above range. Despite his shutdown, Skubal still holds the most innings pitched for any Detroit Tiger this season, and that’s by a margin of over 35 innings.
How does the staff of the Detroit Tigers look as a whole in our IR model? The short answer is, well, not great. The score of all of the injured Tigers this season averages to 12.5. The Major League average is 13.5. The Major League average is still considered "“at-risk” as a whole, but the Tigers do not reach that line. Them falling below that line prompts risk regarding major injury.
To go a bit more in-depth, let’s look at the Tigers on a case-by-case basis.
Player Reports
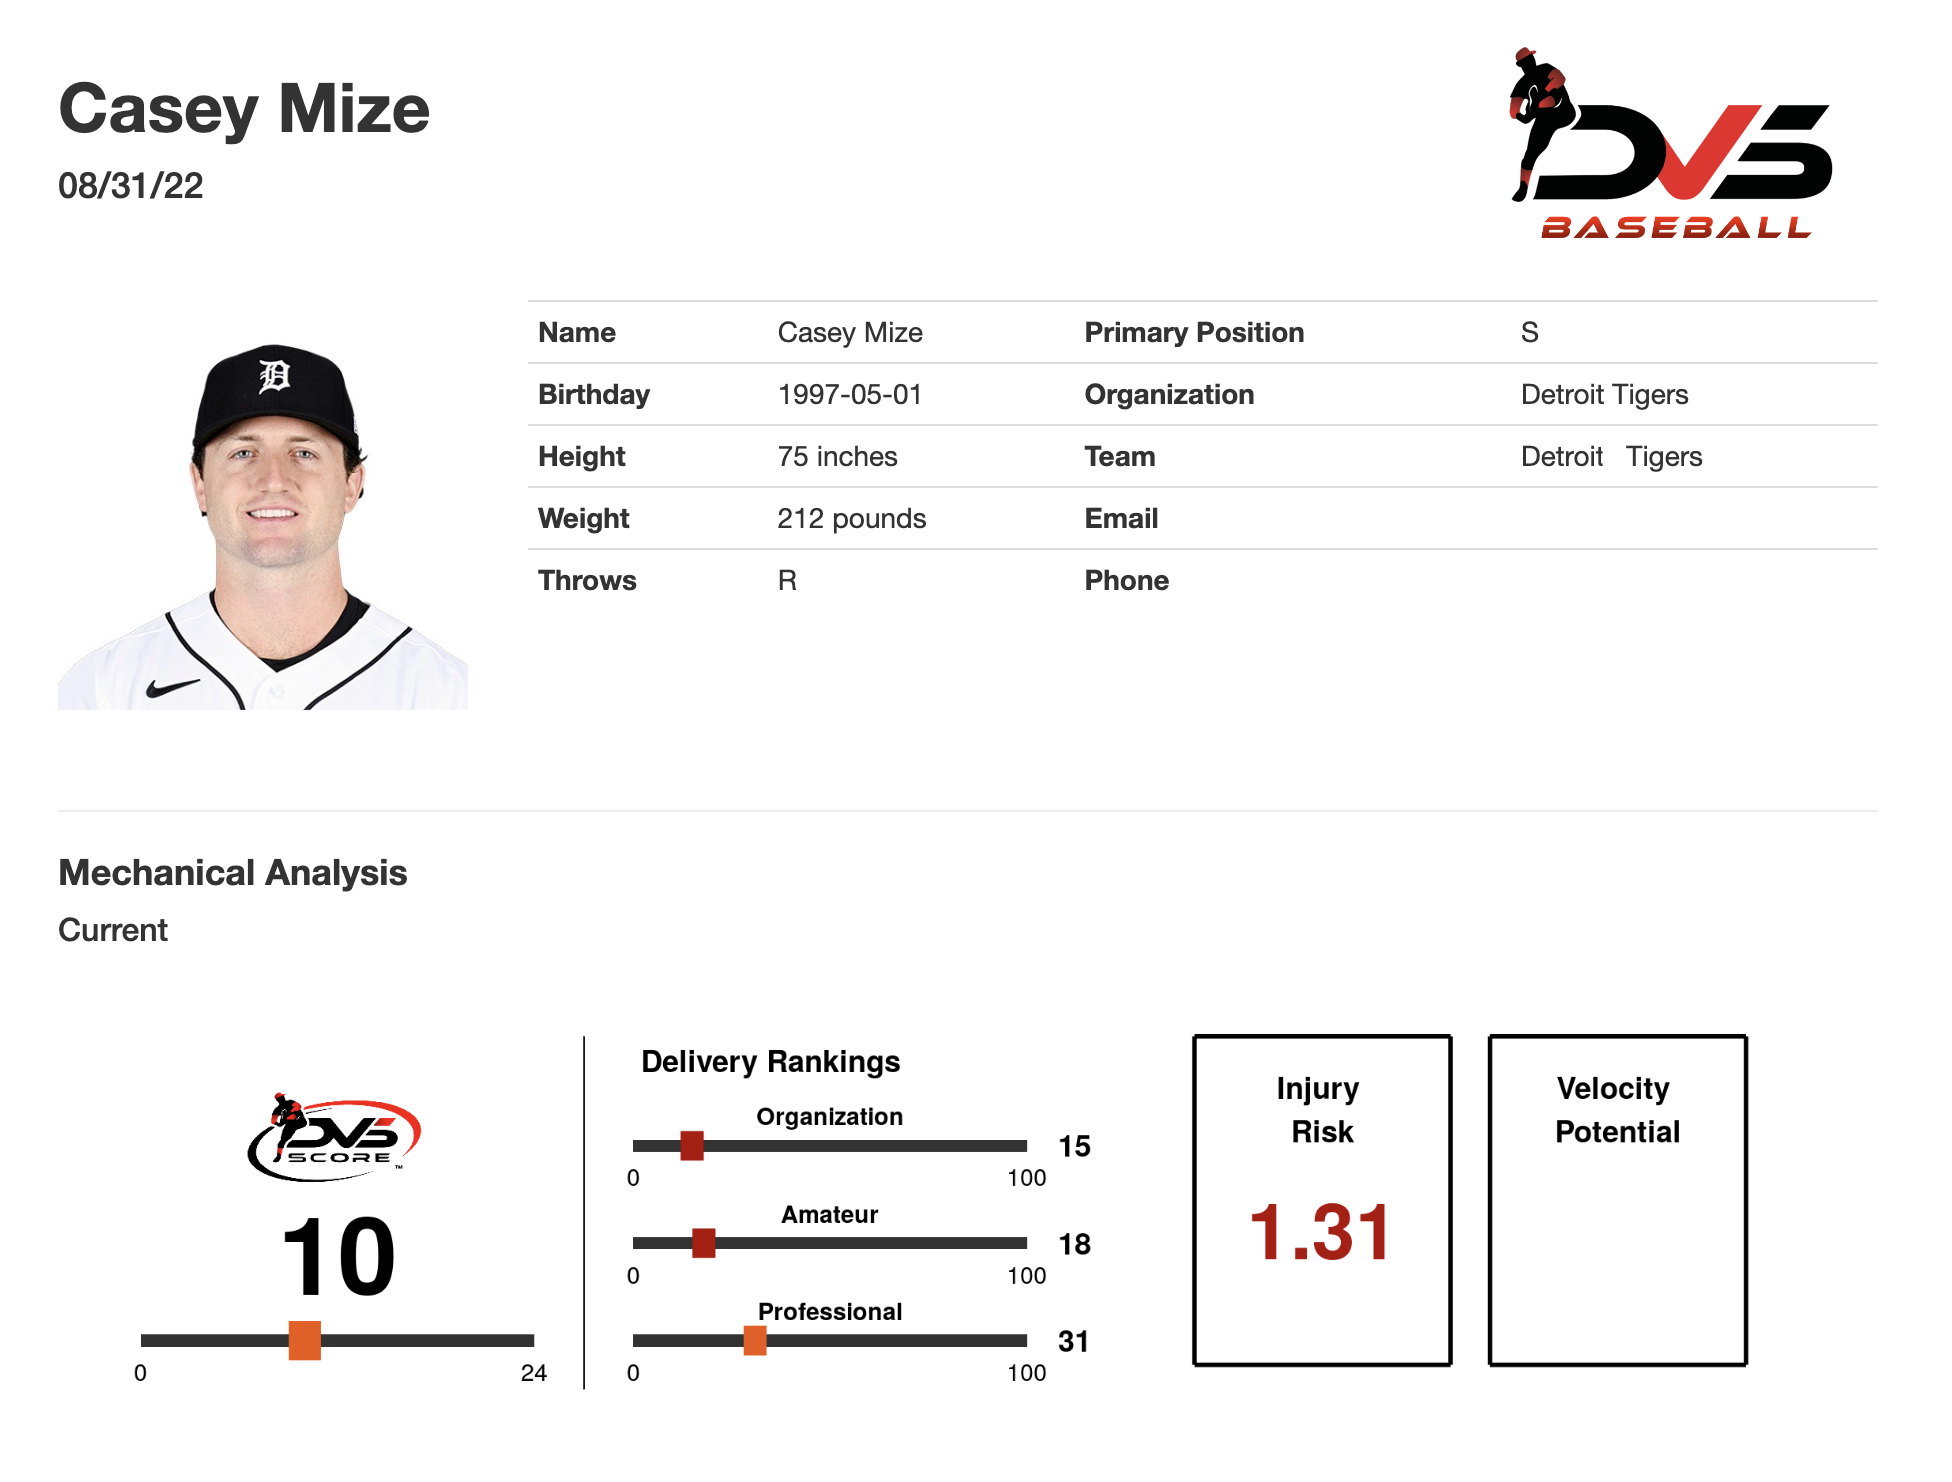
Casey Mize falls into a higher category of injury risk. A few notable mechanical issues put him at extremely high risk, and unforunately this came to fruition in 2022. One of the more notable red flags occurs as he enters the arm swing. Notice how his rear wrist extends above the throwing elbow too soon, this causes the wrist, elbow, and shoulder to rotate too far away from his spine. This factor intensifies the stress on the UCL, and further puts him at risk for TJS.
Max external shoulder rotation of Casey Mize during Acceleration Phase 2.
Rony Garcia has the lowest DVS score on the Tigers Major League staff, scoring a 7. Beau Brieske has the second highest score (just above MLB average) at 14. Let’s take a look at them:
There are a few factors here that led Brieske to have a significantly higher score than Garcia. Some of those notable factors include:
Arm lining up with the spine at foot-strike, or what we call “being on time”
The elbow not pulling back above the shoulder
The amount of elbow retraction is minimal when compared to Garcia
Brieske vs. Garcia
The clip above showcases the differentiation between Brieske and Garcia from the Arm Swing to Foot Strike.
The choices that Garcia makes mechanically put immense stress on his throwing shoulder. It starts to make sense when you realize he has had two IL stints dealing with shoulder soreness in 2022 alone.
With that being said, Brieske’s throwing arm still rises above the elbow before the hips turn, hurting his overall score (upon other factors we didn’t cover). It’s important to remember that while Brieske has one of the highest scores on the team, it still falls below 17, which is the score needed to safely undertake a large sum of innings as a starter.
Hopefully, your understanding of the IR model and how our scoring system works is a bit clearer now. The reality is that there are many factors pitchers can control in order to truly maximize their output. One of these factors is clear from our standpoint, and that’s sequencing. Changes in our sequencing can set us up for long, successful careers. Sequencing goes hand-in-hand with our yearly approach and developmental process, and this is where the Detroit Tigers come to light. I do believe that in both of these areas, there is a cause for concern. Despite our arguments at the start of the season, there are other factors that can be controlled outside of what a player does mechanically. This all boils down to yearly plans. How does a pitcher scale up for the season? How do they scale down? The Tigers seem to be lacking in this area as well.
You may recognize Tiger ace Tarik Skubal hitting a PR of 100.3 in this video. As great as that is, it isn’t what stands out to me. The important note is the date of the video. The video was taken and uploaded in late October. Why is a pitcher hitting PRs deep into the Fall? The scale-down period should be in full swing at this time. If this was in the early spring during the scale-up period, it would make much more sense. How about the Detroit Tiger with the second most innings-pitched on the staff? Beau Brieske is seen here throwing at his highest intensity in January. Highest intent shouldn’t be reached until mid to late Spring Training, which is a ways away. Remember, both of these pitchers faced major injuries in August of 2022.
This brings me to question the Tigers' developmental system. Are they monitoring individual pitcher development? If so, how? Either way, sequential changes and the approach to in-season and offseason development are two key factors to overall longevity and success. The reality is that the ceiling is much higher for the entire Tiger pitching staff. With a focus on sequencing and development, the staff could improve drastically in numerous ways. The ripple effect would lead to more overall team success and a greater approach to pitching as an organization. The evaluation techniques would be apparent in the draft and would allow the Tigers to be a step above.
All of these arguments scale to each level of baseball, whether youth, high school, collegiate, or professional, the logic stays the same. An MLB pitcher needs time to rest in the winter just as a pitcher in high school needs that time as well. Both shouldn’t be fully scaled up until right before tryouts. Remember, our list of goals at DVS is simple: health, longevity, and success.
Either way, whoever the Detroit Tigers select to run the next era of Tiger baseball, the hope is that all of these factors are kept in mind. The building blocks are there for a successful pitching staff, but dependability wins championships.